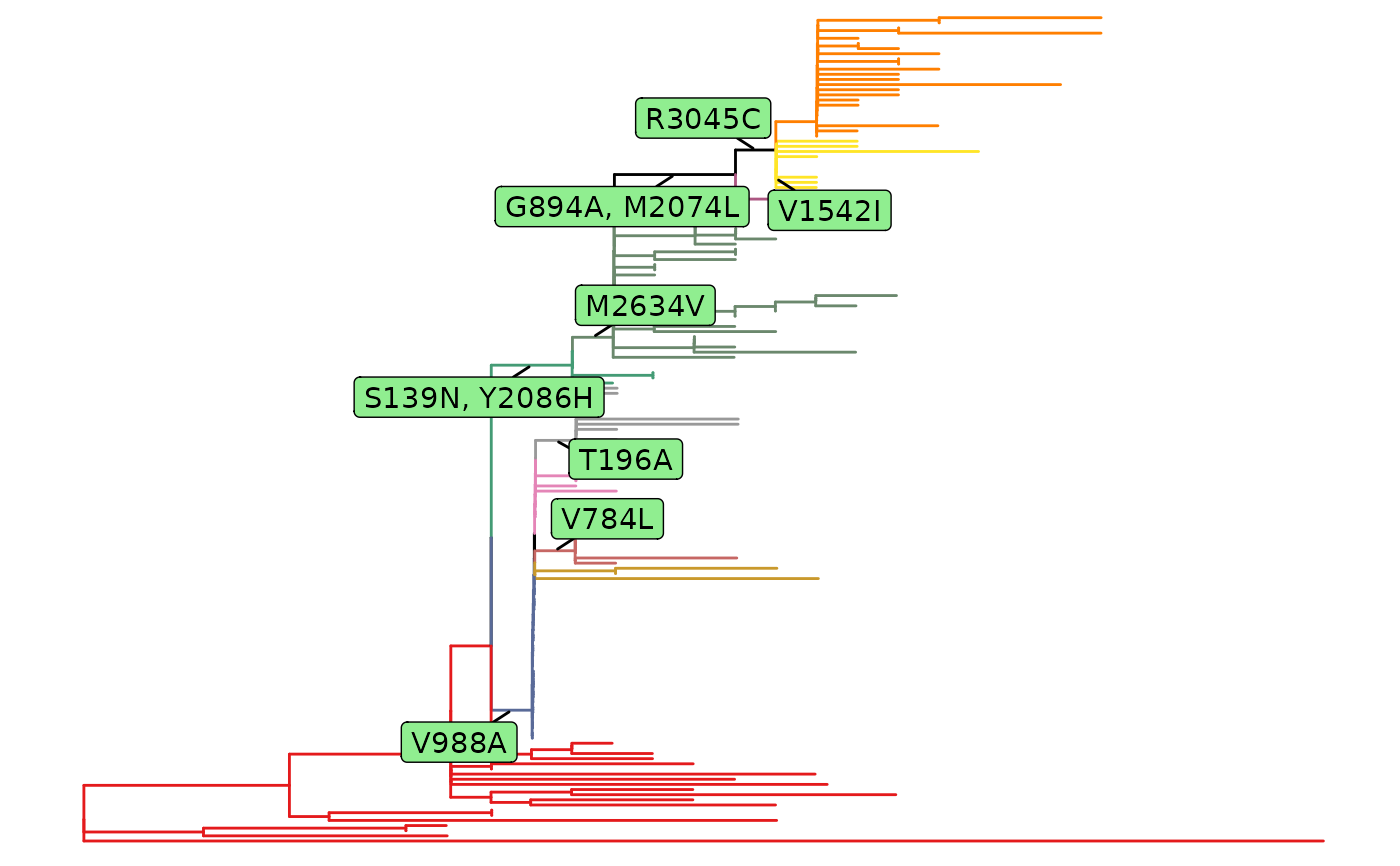
Visualize the results of paraFixSites
plotFixationSites(x, ...)

# S3 method for fixationSites
plotFixationSites(x, site = NULL, ...)

# S3 method for paraFixSites
plotFixationSites(x, site = NULL, ...)
Arguments
- x
return from
paraFixSites- ...
further arguments passed to or from other methods.
- site
the number of the site according to
setSiteNumbering. If not provided, all sites will be plotted as labels on the tree
Value
A ggplot object.
Examples
data(zikv_tree_reduced)
data(zikv_align_reduced)
paraFix <- paraFixSites(zikv_tree_reduced, alignment = zikv_align_reduced)
plotFixationSites(paraFix)