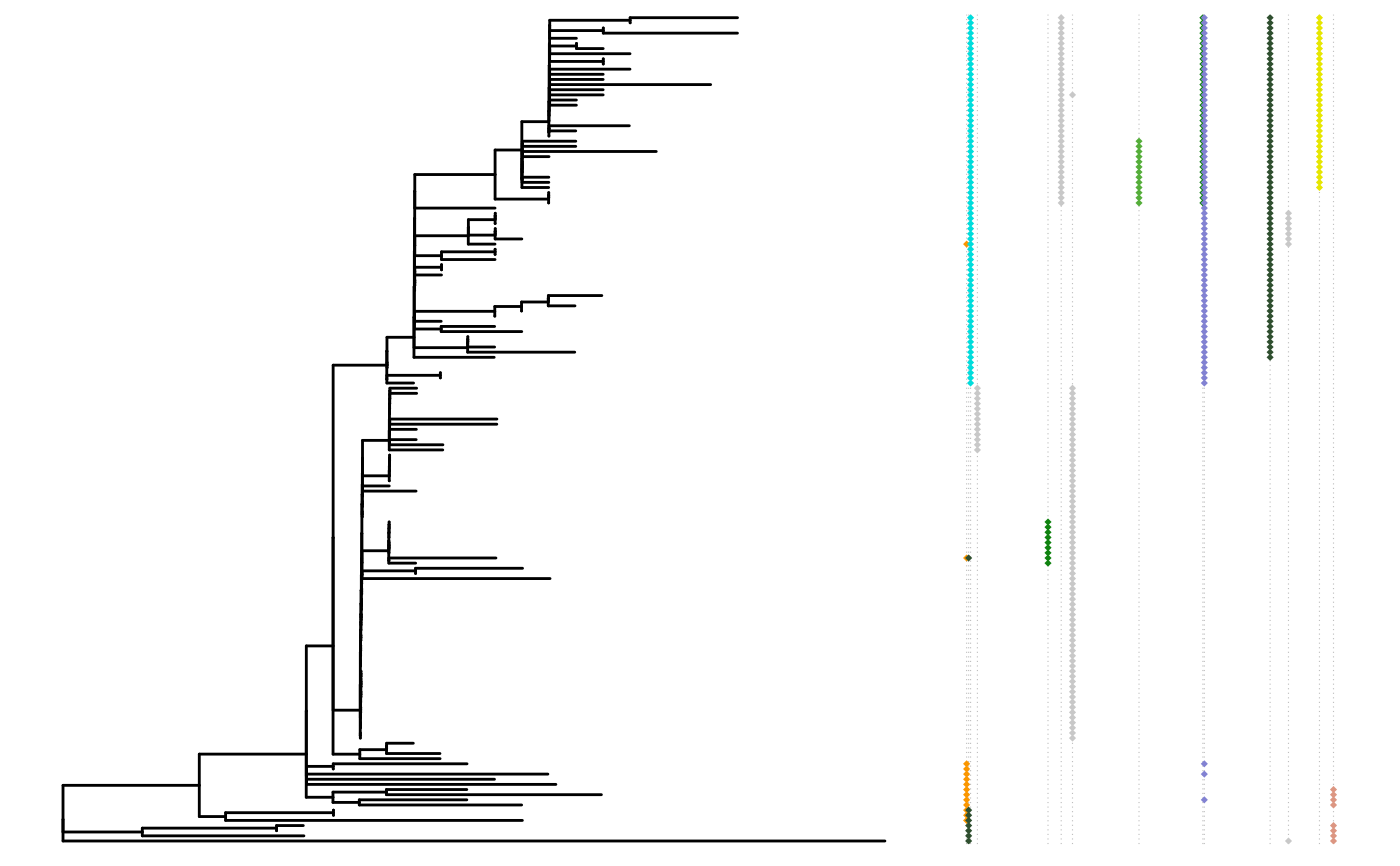
The mutated sites for each tip in a phylogenetic tree will be represented as colored dots positioned by their site number.
plotMutSites(x, ...)

# S3 method for SNPsites
plotMutSites(x, showTips = FALSE, ...)

# S3 method for lineagePath
plotMutSites(x, ...)

# S3 method for parallelSites
plotMutSites(x, ...)

# S3 method for fixationSites
plotMutSites(x, ...)

# S3 method for paraFixSites
plotMutSites(
  x,
  widthRatio = 0.75,
  fontSize = 3.88,
  dotSize = 1,
  lineSize = 0.5,
  ...
)
Arguments
- x
An
SNPsitesobject.- ...
Other arguments
- showTips
Whether to plot the tip labels. The default is
FALSE.- widthRatio
The width ratio between tree plot and SNP plot
- fontSize
The font size of the mutation label in tree plot
- dotSize
The dot size of SNP in SNP plot
- lineSize
The background line size in SNP plot
Value
A tree plot with SNP as dots for each tip.