Plot and color the tree according to amino acid/nucleotide of
the selected site. The color scheme depends on the seqType set in
addMSA function.
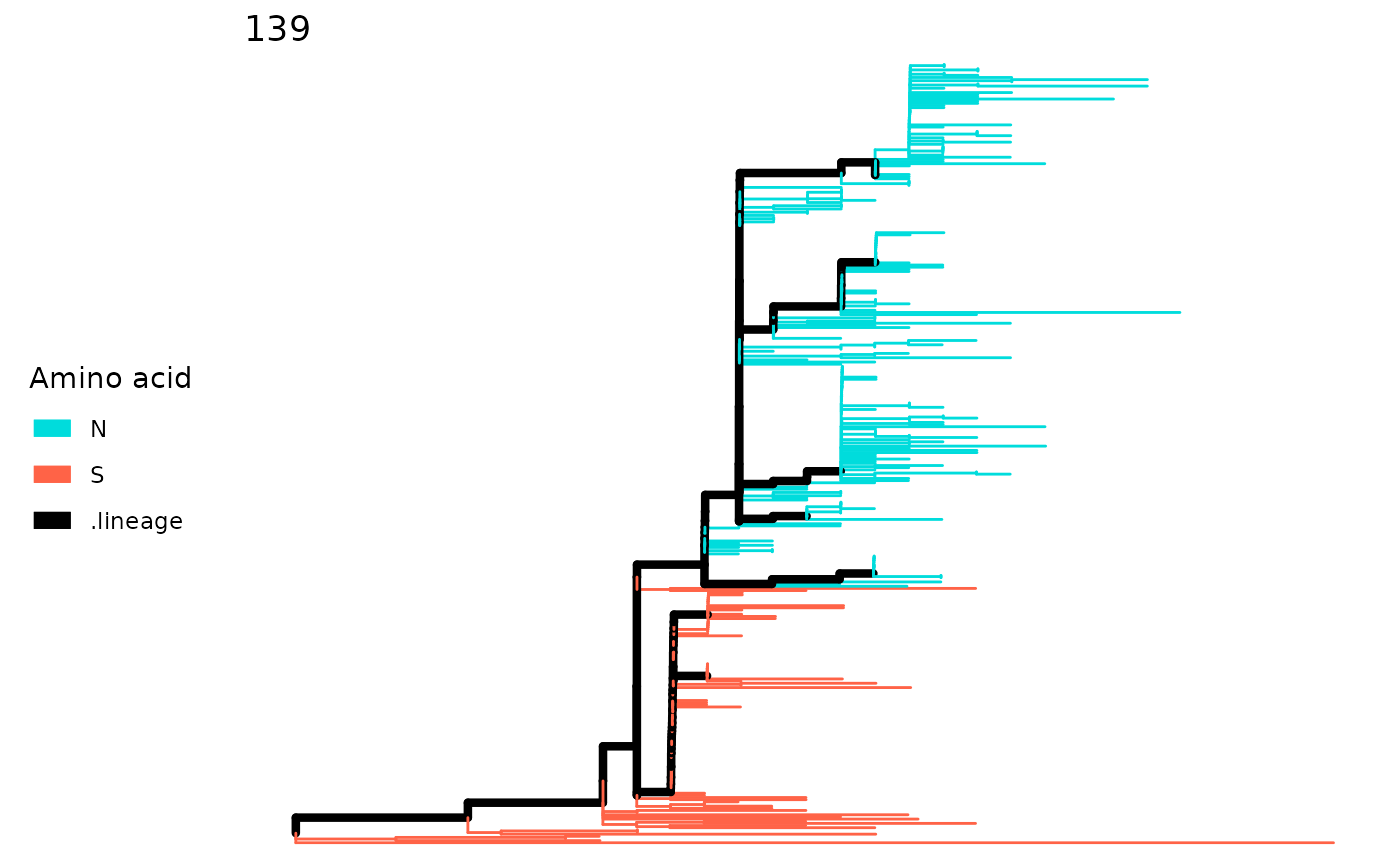
For lineagePath, the tree will be colored
according to the amino acid of the site. The color scheme tries to assign
distinguishable color for each amino acid.
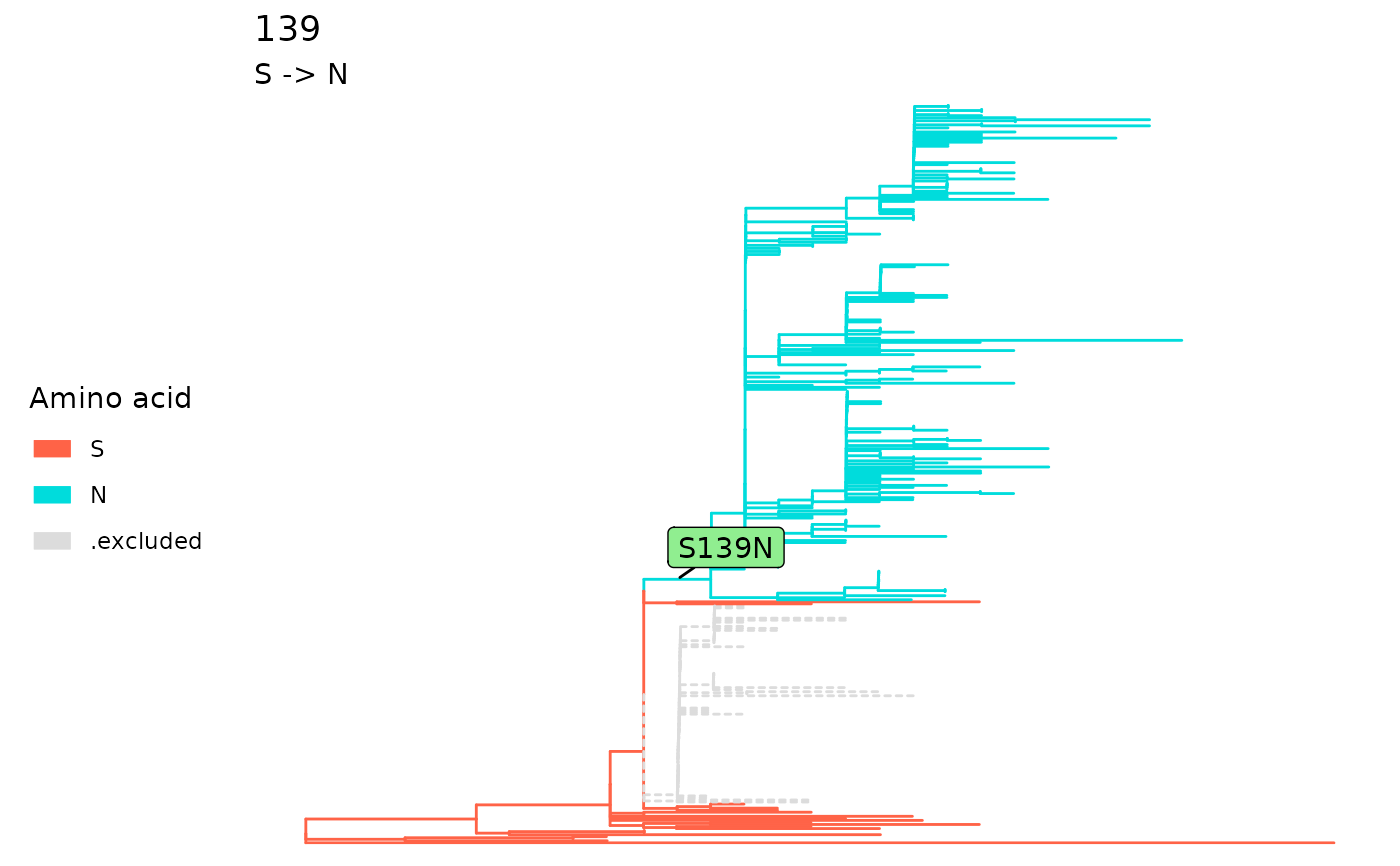
For parallelSites, the tree will be colored
according to the amino acid of the site if the mutation is not fixed.
For fixationSites, it will color the ancestral
tips in red, descendant tips in blue and excluded tips in grey.
plotSingleSite(x, site, ...)

# S3 method for lineagePath
plotSingleSite(x, site, showPath = TRUE, showTips = FALSE, ...)

# S3 method for sitesMinEntropy
plotSingleSite(x, site, ...)

# S3 method for parallelSites
plotSingleSite(x, site, showPath = TRUE, ...)

# S3 method for fixationSites
plotSingleSite(x, site, select = NULL, ...)
Arguments
- x
The object to plot.
- site
For
lineagePath, it can be any site within sequence length. ForfixationSitesandparallelSites, it is restrained to a predicted fixation site. The numbering is consistent with the reference defined bysetSiteNumbering.- ...
Other arguments. Since 1.5.4, the function uses
ggtreeas the base function to make plots so the arguments inplot.phylowill no longer work.- showPath
If plot the lineage result from
lineagePath. The default isTRUE.- showTips
Whether to plot the tip labels. The default is
FALSE.- select
Select which fixation path in to plot. The default is NULL which will plot all the fixations.
Value
Since 1.5.4, the function returns a ggplot object so on longer
behaviors like the generic plot function.
See also
Examples
data(zikv_tree)
data(zikv_align)
tree <- addMSA(zikv_tree, alignment = zikv_align)
paths <- lineagePath(tree)
plotSingleSite(paths, 139)

fixations <- fixationSites(paths)
plotSingleSite(fixations, 139)
fixations <- fixationSites(paths)
plotSingleSite(fixations, 139)